

By now, you have launched and promoted your B2B online marketplace platform. Also, you have users in your marketplace, but how does this determine your B2B marketplace platform’s success and growth? You need online marketplace KPIs to measure them.
Industry changes and evolution are happening in the B2B online marketplace industry. Payment methods, market prospects, business strategies, and many other elements of this ecosystem are constantly changing.
As a result, many businesses employ specific criteria to define and assess the performance and success of their online markets.
Sometimes things aren’t as apparent as they seem. Since there are many online marketplace metrics, you must select them by seeing their worth and purpose.
Answer this question, Which B2B marketplace KPIs are worth using, and for what?
Is there a chance that B2B marketplace metrics will no longer affect productivity but will instead stand alone as a thing?
Of course!
Just as the B2B marketplace platform differs highly in terms of the product categories it offers and the demographics of its clientele, so do its benchmarks.
B2B marketplace KPIs can be measured by four factors,
Business Marketplace KPIs
1. Online Marketplace KPIs to measure the platform’s transactions.
2. B2B Marketplace KPIs to measure the platform’s success.
Marketing Marketplace KPIs
3. Online Marketplace Metrics to analyze and grow user engagement
4. B2B Marketplace Metrics to evaluate user satisfaction
B2B Marketplace KPIs To Measure Transactions
Your profit is calculated by the transactions that happened on the platform. So, let’s start measuring from the transactions.
It can be tempting to concentrate on the volume of transactions that could affect your value proposition when looking at transaction-related B2B marketplace metrics. Indeed, a lot of sellers like sites like eBay, Amazon, or Etsy since they have a greater average number of transactions per user.
However, the volume of transactions is only a vanity statistic because it offers no guidance on how to improve the functionality of your platform. To encourage long-term growth, we suggest concentrating on the online marketplace metrics listed below:
Seller Liquidity
What it is: Seller liquidity is a crucial marketplace KPIs that assesses how active and responsive the seller base is on your B2B marketplace platform. It measures the speed at which sellers can convert their inventory into sales.
Why it matters: The number of active sellers, coupled with their ability to promptly turn over inventory, signals a vibrant and healthy marketplace. This indicates that sellers find value in the platform, ensuring a diverse and dynamic product offering for potential buyers.
Strategies for Improvement:
- Encourage sellers through promotional campaigns and discounts to keep their inventory fresh and updated.
- Provide tools and analytics to help sellers optimize their pricing and inventory management.
- Implement a responsive customer support system for sellers to address any concerns or issues promptly.

Buyer Liquidity
What it is: This marketplace KPIs monitors the number of active buyers and their level of engagement on the platform. It reflects the health of the buyer community and their responsiveness to the offerings on the B2B marketplace.
Why it matters: A thriving marketplace attracts a substantial pool of potential buyers, demonstrating that the platform effectively meets their needs and preferences. More engaged buyers contribute to a healthy ecosystem, fostering competition among sellers and ensuring a variety of products and services.
Strategies for Improvement:
- Implement targeted marketing campaigns to attract new buyers and retain existing ones.
- Offer personalized recommendations based on buyer preferences to enhance their engagement.
- Provide a seamless and user-friendly interface to encourage easy navigation and transactions.

Average Order Value (AOV)
What it is: Average Order Value (AOV) represents the average amount spent by buyers in a single transaction on the B2B platform.
Why it matters: An increasing AOV is a positive sign, suggesting that buyers are making larger transactions. This can contribute to higher overall revenue and is an indicator of the platform’s ability to facilitate substantial business transactions.
Strategies for Improvement:
- Implement cross-selling and upselling strategies to encourage buyers to add more items to their carts.
- Offer bulk discounts or exclusive deals for larger orders to incentivize higher spending.
- Enhance the overall user experience to make it conducive for buyers to explore and purchase more products in one go.

Buyer-To-Seller Ratio
What it is: The buyer-to-seller ratio is a metric that helps you understand the balance between the number of buyers and sellers on your B2B platform.
Why it matters: Maintaining a balanced buyer-to-seller ratio is crucial for a healthy marketplace. Too many buyers and not enough sellers may lead to increased competition among buyers for limited offerings, potentially driving up prices.
Strategies for Improvement:
- Actively recruit new sellers to the platform to meet the growing demand.
- Provide incentives for sellers to join and participate in the marketplace.
- Implement dynamic pricing strategies to balance supply and demand effectively.
This ratio is usually 1:3 for the new startups, but it will be 2-3 buyers for each seller in the stable marketplace. This ratio completely depends on the marketplace growth.
The buyer-to-seller ratio can be as low as 1:1, where the marketplace has one seller and one buyer. Also, it can be as high as 1:1000, where one seller serves 1000 buyers. So, there are no set ratios of buyers to sellers.

Repeat Purchase Rate
What it is: The repeat purchase rate measures how often buyers return for additional transactions on the B2B marketplace platform.
Why it matters: A high repeat purchase rate indicates that your platform successfully retains customers, fostering loyalty. Repeat customers are often more valuable over time, contributing to a stable and predictable revenue stream.
Strategies for Improvement:
- Implement a loyalty program offering rewards or discounts for repeat purchases.
- Collect feedback from buyers to understand their preferences and tailor offerings accordingly.
- Continuously improve the user experience to encourage buyers to return.

So far, you have measured your B2B online marketplace platform using transactions. Now it’s time to measure your marketplace business success.
B2B Marketplace Metrics To Measure Profit
Gross Merchandise Volume (GMV)
What it is: Gross Merchandise Volume (GMV) represents the total value of transactions conducted on the B2B platform.
Why it matters: Tracking GMV is crucial for understanding the scale and overall transaction volume of your platform. A growing GMV indicates increasing business activity.
Strategies for Improvement:
- Expand the product and service catalog to attract a wider range of transactions.
- Invest in marketing and promotional activities to drive more transactions on the platform.
- Foster strategic partnerships to bring in high-value transactions and increase overall GMV.

Client Acquisition Cost (CAC)
What it is: Client Acquisition Cost (CAC) measures the cost of acquiring a new customer, including marketing and sales expenses.
Why it matters: Knowing the CAC is essential for budgeting and understanding the efficiency of your customer acquisition strategies. Lower CACs generally indicate more cost-effective approaches.
Strategies for Improvement:
- Utilize data analytics to identify the most effective marketing channels and allocate resources accordingly.
- Optimize advertising campaigns to target the most relevant audience and reduce acquisition costs.
- Implement referral programs to leverage existing satisfied customers for acquiring new clients.

Client Lifetime Value (CLV)
What it is: CLV shows the amount of time a user spends using a platform before uninstalling it or ceasing its use of it. This value should not exceed the CAC. Because your growth is not sustainable when CLC exceeds the CAC.
Why it matters: If the CLV exceeds the CAC, it signifies a positive outcome – that your platform is generating a profit from each customer relationship. This is a key factor in predicting the platform’s financial success.
Strategies for Improvement:
- Focus on providing exceptional customer service to increase customer satisfaction and loyalty.
- Offer subscription models or long-term contracts to ensure a consistent revenue stream.
- Continuously innovate and update offerings to keep customers engaged and interested.

Take Rate
What it is: The take rate reveals the portion of GMV retained as revenue by the platform after accounting for fees or commissions paid to sellers.
Why it matters: Monitoring the take rate is essential for ensuring that your revenue model is sustainable and profitable. It helps you strike the right balance between generating revenue and providing value to sellers.
Strategies for Improvement:
- Regularly review and adjust commission structures to align with market trends.
- Provide additional value-added services to justify commission rates.
- Communicate transparently with sellers about the benefits they receive in exchange for the platform’s take rate.

Cost of Goods Sold (COGS)
What it is: Cost of Goods Sold (COGS) accounts for the direct expenses related to delivering goods or services on the B2B platform.
Why it matters: Understanding COGS is vital for managing profitability. It provides insights into the direct costs associated with facilitating transactions on your platform.
Strategies for Improvement:
- Negotiate bulk deals with suppliers to reduce the cost of goods sold.
- Optimize logistics and fulfillment processes to minimize operational costs.
- Continuously assess and renegotiate contracts with service providers to ensure cost-effectiveness.

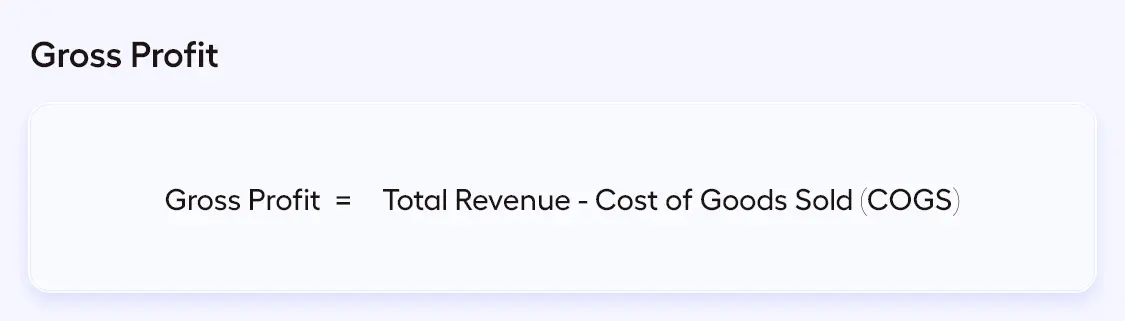
Gross Profit
What it is: Gross profit is the revenue left after deducting COGS from the total platform revenue.
Why it matters: It reflects the core profitability of your platform, considering the direct costs associated with providing goods or services. It’s a key indicator of the platform’s financial health.
Strategies for Improvement:
- Regularly review pricing strategies to maintain a healthy balance between revenue and costs.
- Invest in technologies and automation to streamline operations and reduce costs.
- Explore opportunities for diversification to increase revenue streams and overall gross profit.
Net Profit
What it is: Net profit takes into account all expenses, including COGS and operating costs.
Why it matters: Net profit represents the platform’s earnings after all costs are factored in. It’s a critical indicator of the overall financial health and sustainability of your B2B platform.
Strategies for Improvement:
- Implement cost-cutting measures without compromising on the quality of services.
- Explore new revenue streams or business models to increase overall profitability.
- Continuously monitor and optimize operational efficiency to maximize net profit margins.

So, next is the Marketing and Sales metrics. If your marketplace customers don’t feel satisfied with your platform, they have so many options to choose from. Thus, you can’t simply rely on your gut feeling about your customer satisfaction, you need to measure them.
Your marketplace platform business may be adjusted to increase sales and marketing efforts and improve the consumer buying experience with the help of the proper marketing KPIs.
Utilizing these B2B marketing KPIs can assist you with inventory management, pricing strategy, orders, and creating a positive customer experience that will encourage repeat business from retail customers.
B2B Online Marketplace Metrics To Analyze and Grow User Engagement
To check how users interact with your marketplace platform, you must analyze the usage.
Also, to decide the number of visitors, bounce rate, and time spent on the site are with these metrics.
Every marketplace platform tracks the same fundamental marketing metrics to track its development; these data are not exclusive to marketplaces.
Monthly/Daily Active Users (MAU or DAU)
What it is: These metrics quantify the number of unique users actively participating in your platform over a specific period, whether daily or monthly.
Why it matters: High MAU or DAU indicates a vibrant and consistently engaged user community. This is crucial for sustaining a thriving online platform and attracting potential advertisers or business opportunities.
Strategies for Improvement:
- Introduce new and engaging features to keep users interested and active.
- Invest in targeted marketing campaigns to increase user acquisition and retention.
- Collaborate with influencers or industry experts to create buzz and attract more users.
These online marketplace metrics can provide insights into user behavior, help identify trends, and inform decisions related to product development, marketing strategies, and user acquisition efforts.
They are often used in conjunction with other key performance indicators (KPIs) to assess the health and success of a digital product or service.


Traffic (Organic / Paid)
What it is: Traffic metrics help you understand the number of visitors to your platform and categorize them into organic (unpaid) or paid (resulting from advertising) sources.
Why it matters: Organic traffic reflects the inherent appeal of your platform, while paid traffic shows the effectiveness of marketing efforts. This information guides your marketing strategy and helps allocate resources efficiently.
Strategies for Improvement:
- Optimize SEO strategies to enhance organic visibility and attract more organic traffic.
- Invest in paid advertising campaigns strategically to target specific user segments.
- Analyze traffic data to understand user behavior and tailor marketing efforts accordingly.
Bounce Rate
What it is: Bounce rate measures the percentage of visitors who navigate away after viewing only one page.
Why it matters: A lower bounce rate suggests that visitors find your content relevant and engaging, contributing to a positive user experience. Improving this metric often involves enhancing the attractiveness and navigability of your platform.
Strategies for Improvement:
- Optimize website design and user interface for a seamless and intuitive experience.
- Provide relevant and compelling content to encourage users to explore further.
- Conduct A/B testing to identify and implement changes that reduce bounce rates.
Time Spent on the Platform
What it is: This metric tracks the average amount of time users spend on your platform during each visit.
Why it matters: Longer time spent indicates user engagement and interest. It helps identify popular features, content, or services, providing insights to enhance and tailor the user experience.
Strategies for Improvement:
- Introduce interactive and immersive content to keep users engaged for longer durations.
- Implement personalization features to deliver customized experiences that hold user interest.
- Continuously monitor user feedback to identify areas for improvement in platform usability.
So far, you have measured your B2B online marketplace platform using transaction and user engagement. Now it’s time to measure your marketplace business success.
B2B Online Marketplace Metrics to Evaluate User Satisfaction
We’ll go over two useful methods for marketplace businesses to measure user satisfaction: Net Promoter Score (NPS) and Customer Satisfaction Score (CSAT).
Net Promoter Score (NPS)
What it is: NPS measures the likelihood of users recommending your platform to others, categorizing them as promoters, passives, or detractors.
Why it matters: A high NPS indicates satisfied users who are likely to become advocates, contributing to positive word-of-mouth and organic growth.
Strategies for Improvement:
- Actively seek feedback from users to identify areas of improvement.
- Implement customer service initiatives to address user concerns and enhance satisfaction.
- Leverage positive feedback by showcasing testimonials and reviews to build trust.
After a sale, you may contact the consumers and ask them to give your product or service a rating between 0 and 10.
How likely are you to refer your brand to a friend or work colleague, as an example of a question?
After that, you can group their responses into one of three categories:
- 9–10(Promoters): Brand-loyal audiences who promote your business continue to make purchases from you and enthusiastically refer others to it.
- 7-8(Passives): Passives are clients who are impartial and happy with your goods or services but aren’t too enthused. They are frequently open to threats from rivals’ products.
- 0–6(Detractors): Detractors are dissatisfied customers who will complain about your brand and occasionally share their displeasure with others.

You can calculate NPS using the formula:

Customer Satisfaction Score (CSAT)
What it is: CSAT involves users rating their satisfaction on a scale after a particular interaction or experience.
Why it matters: Regularly collecting CSAT scores provides a quick assessment of user happiness, helping to identify areas for improvement and maintain overall satisfaction.
Strategies for Improvement:
- Implement proactive customer support to address issues before they impact satisfaction.
- Use CSAT scores to identify specific pain points in the user journey and address them.
- Communicate updates and improvements to users based on their feedback to show responsiveness.
On a scale of 1-3, 1-5, or 1-10, users are typically asked to rate a product or service. Your CSAT can be determined using the formula below,

Now you have a complete understanding of B2B online marketplace Kpis to measure your B2B marketplace platform growth. But, apart from these, you need to consider other marketing metrics to make more accurate predictions. Here are some of the marketing KPIs you need to note.
Word-of-mouth
What it is: Positive word-of-mouth involves users voluntarily recommending your platform to others.
Why it matters: Organic growth resulting from word-of-mouth signifies a strong user base and positive sentiment, contributing to increased user acquisition.
Strategies for Improvement:
- Encourage users to share positive experiences by providing easy-to-use sharing features.
- Implement referral programs to reward users for recommending the platform to others.
- Monitor social media and other online channels for mentions and actively engage with positive reviews.

Engagement
What it is: Engagement measures user involvement beyond basic visits, including interactions like commenting, sharing, or participating in community features.
Why it matters: Higher engagement levels indicate an active and loyal user base. It fosters a sense of community, which is crucial for long-term platform success.
Strategies for Improvement:
- Foster a sense of community through forums, discussion boards, or user groups.
- Regularly update content and features to keep users engaged and coming back.
- Encourage user-generated content and interactions to enhance the overall sense of community.
Sign-Up
What it is: Sign-up metrics track the number of new user registrations.
Why it matters: An increasing number of sign-ups signifies successful marketing efforts and a growing user base. It’s a fundamental metric for assessing the effectiveness of your user acquisition strategies.
Strategies for Improvement:
- Optimize the sign-up process to make it quick, easy, and appealing.
- Implement targeted marketing campaigns to drive sign-ups from specific user segments.
- Offer incentives such as discounts or exclusive access to encourage sign-ups.
Better Client Appraisals Based on the Feedback
Evaluating the success of an online marketplace platform goes beyond just tracking sign-ins and usage statistics. It’s essential to analyze customer behavior and regularly collect feedback from active users.
This feedback loop helps you understand their evolving needs, preferences, and pain points, allowing you to make continuous improvements and provide a better user experience.
Percentage Of Active Users
What it is: This metric calculates the percentage of total users actively engaging with the platform.
Why it matters: A high percentage indicates that a significant portion of your user base remains active, showcasing the effectiveness of user retention strategies.
Strategies for Improvement:
- Implement personalized recommendations and content to keep users engaged.
- Analyze user behavior to identify patterns that lead to increased activity.
- Introduce gamification elements to incentivize continued engagement.
Number of Paying Users
What it is: Counts the users who make monetary transactions on your platform.
Why it matters: The number of paying users directly contributes to revenue generation. Monitoring this metric is vital for assessing the financial health and sustainability of your platform.
Strategies for Improvement:
- Introduce premium features or subscription models to incentivize users to become paying customers.
- Provide exclusive discounts or benefits for paying users to enhance value.
- Continuously communicate the value proposition to encourage free users to convert to paying customers.

Churn Rate
What it is: Churn rate measures the percentage of users leaving your platform within a specific period.
Why it matters: A high churn rate may signal issues with user satisfaction, usability, or increased competition. Reducing churn is crucial for maintaining a growing and stable user base.
Strategies for Improvement:
- Conduct exit surveys to understand the reasons behind user churn.
- Implement targeted retention campaigns to re-engage users at risk of churning.
- Continuously update and improve the platform based on user feedback to address underlying issues.

Let’s Conclude This By,
In this chapter, you’ve gained insights into the critical performance metrics for marketplace businesses. To ensure your marketplace is on a path to success, it’s imperative to measure and evaluate these marketing metrics.
These online marketplace metrics provide a means to assess your market’s performance, pinpoint areas in need of improvement, and optimize efficiency.
Success can vary based on the specific type of marketplace you’re operating, and your choice of metrics will depend on the areas you aim to enhance.
Marketplace KPIs related to usage, transactions, business performance, and user satisfaction are all essential to keep a close eye on. Historical data can tell you what’s happening in your industry, but understanding the reasons behind it is equally crucial.
To gain deeper insights, engaging with your users is vital. Quantifying user feedback data using user satisfaction metrics is a valuable approach.
Among these metrics, the Customer Satisfaction Score and Net Promoter Score are particularly significant in gauging user satisfaction and the likelihood of users recommending your platform to others.


